Figure 3.
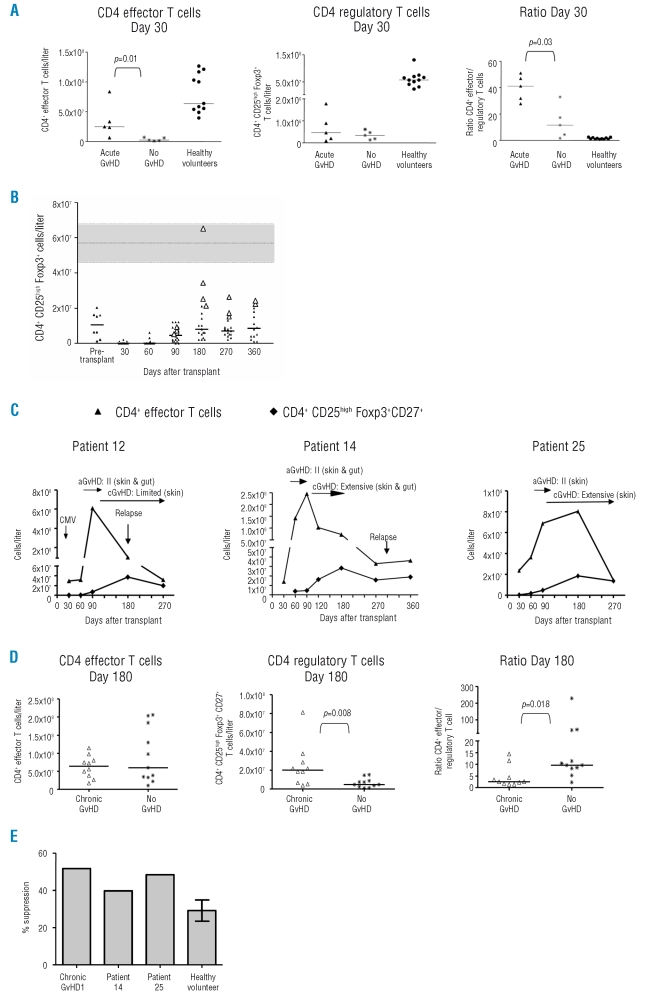
Reconstitution of regulatory CD4 T cells after allogeneic HSCT. (A) Numbers of regulatory CD4 T cells (CD25high Foxp3+) (left panel) and effector CD4 T cells (CD45RO+ CD27− and CD45RO− CD27−) (middle panel) at day 30 and their relative ratios (right panel) in patients who did or did not develop acute GvHD and in 11 age-matched healthy volunteers. Short horizontal lines indicate the median values. (B) Dynamics of CD4 CD25high Foxp3+ T-cell reconstitution. Short horizontal lines indicate the median value at each time point and horizontal dotted lines enclosing gray boxes represent the median and inter-quartile range for 11 age-matched healthy volunteers. Enlarged white triangles indicate patients who developed chronic GvHD. (C) Effector (CD45RO+ CD27− and CD45RO− CD27−) and regulatory CD4 CD25+ Foxp3+ CD27+ T-cell dynamics for the same three GvHD patients shown in Figure 2. (D) Numbers of regulatory CD4 T cells (CD25high Foxp3+ CD27+) (left panel) and effector CD4 T cells (CD45RO+ CD27− and CD45RO− CD27−) (middle panel) at day 180 and their relative ratios (right panel) in patients with chronic GvHD (four from the cohort and six additional patients who underwent the same transplant preparative regimen) and patients without GvHD. Short horizontal lines indicate the median values. (E) Percentage suppression of the in vitro proliferation of CD4 CD25− T cells from a healthy volunteer by CD4 CD25high T cells. Putative regulatory T cells were analyzed from two patients in the study cohort (patient 14 at day 120 and patient 25 at day 150), an additional patient with chronic GvHD (cGvHD1 at day 150) who underwent the same transplant preparative regimen and three autologous experiments with the healthy volunteer (mean and SEM shown).

