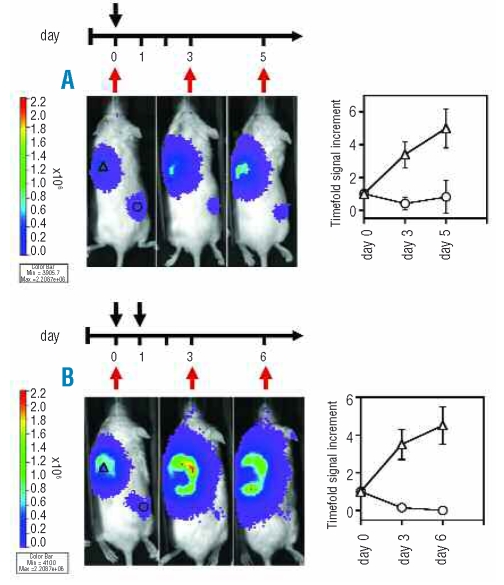
Figure 5.
Adoptive therapy of NOD/SCID mice carrying small ffluc+C1R-CD1d nodules. Engrafted mice were selected on the basis of the C1R-CD1d nodule light intensity. (A) Mice were treated with 1x10⁷ NKTA cells and α-GalCer at day 0. (B) Mice were treated with 1x10⁷ NKTA cells and α-GalCer at day 0 and day 1. Red arrows denote day of imaging, black arrows denote day of treatment. On the right side the representation of luc+C1R-CD1c (triangles) and luc+C1R-CD1d (circles) nodule growth curves is reported. Curve values indicate the timefold signal increment obtained through the ratio of the light intensity values recorded at day 3, 5 (or 6) to value recorded at day 0. The data are representative of two (A) and three (B) experiments.

