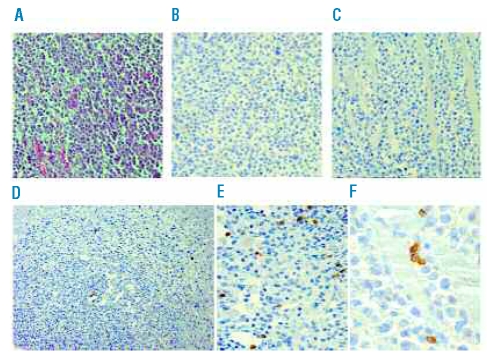
Figure 6.
Immunohistochemical analyses of NKT cells in paraffin embedded sections derived from CD1d and CD1c nodules. (A) Hematoxylin-eosin stained section of a nodule showing the massive infiltration of lymphoid cells, (B) staining with an anti-CD3 moAb of a CD1d nodule derived from a mouse that received inoculation of α-GalCer only; no reactive cells are observed, (C) CD3 staining of CD1c nodule 48 h after the inoculation of 107 NKT cells and α-GalCer; positive cells are rarely observed; (D, E) and (F) CD3 staining of CD1d nodule 48 h after the inoculation of 107 NKT cells and α-GalCer; several fields show numerous positive cells. Original magnification of A, B, C and E 200 X; magnification of D 100 X; magnification of F 400 X.

