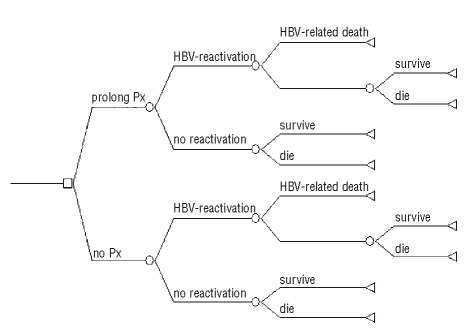
Figure 2.
Decision Tree: a clinical decision tree is a schematic display of the temporal and logical structure of a clinical situation in which one or more decisions must be made. Squares represent decision nodes from which two competing strategies originate. They denote a point in time in which we can elect one of several alternative courses of actions. Circles are chance nodes from which a study leads to a particular outcome, beyond the control of our decision. Terminal nodes (endpoints) represent the final outcome (3yrOS) of a particular pathway. A path (or scenario) in a decision tree is a particular sequence of actions beginning with a particular choice at the initial decision node (Prolong Prophylaxis vs. No Prophylaxis) and following a particular event or choice from left to right. The decision tree compares the strategy of prolonging prophylaxis with that of no prophylaxis. At baseline, the prophylaxis strategy results in 2.4% net benefit in 3yrOS compared to no prophylaxis, a positive benefit preserved for a wide range of probabilities in sensitivity analysis.

