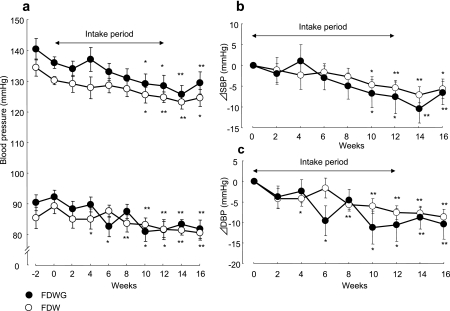
Fig. 1.
Time course of blood pressure (a) during the preobservation term, the intake period of FDWG (n = 10, closed circles) or FDW (n = 11, open circles), and after finishing intake in group-H, and changes (relative to baseline values) in systolic (SBP) (b) and diastolic (DBP) (c) blood pressure after the intake of FDWG or FDW. Each point represents the mean ± standard error. *p<0.05 and ** p<0.01 (paired t test) compared to the 0-week value.

