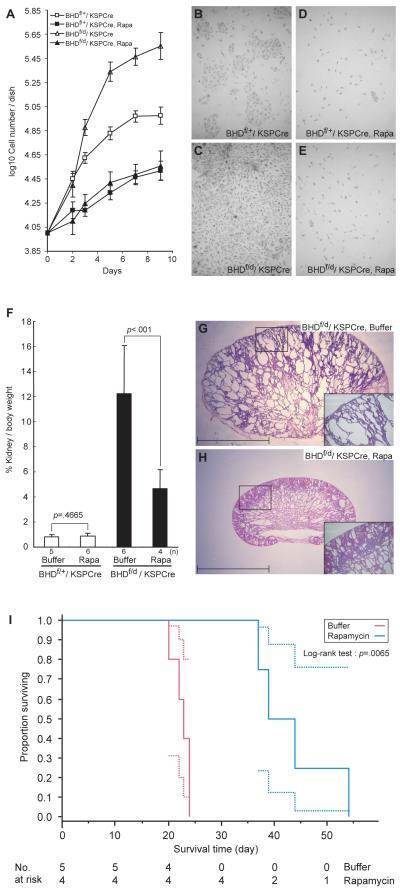
Fig.7. Effect of rapamycin, inhibitor of mTOR signaling, on BHD knockout kidney tubule cell proliferation in vivo and in vitro and on survival of BHDf/d/KSP-Cre mice.
A) Tubule cells from the kidneys of 3-week-old control (n=1) and BHD-knockout (n=1) mice were isolated, cultured in the presence and absence of rapamycin (10 nM), and counted to evaluate cell proliferation. B-E) Representative images of untreated and treated cells from control mice (B and D) and those of BHD knockout mice (C and E) taken at day 9 are shown. Data are represented as means and 95% confidence intervals. F) Rapamycin (2 mg/kg/day) or buffer was injected into BHDf/d/KSP-Cre and BHDf/+/KSP-Cre mice (BHDf/+: buffer, n=5, rapamycin, n=6; BHDf/d: buffer, n=6, rapamycin, n=4). Mice were dissected at 3 weeks, and relative kidney/body weight ratios (100 X kidney weight / [body weight–kidney weight]) were calculated. Relative kidney/body weight ratios in BHDf/d/KSP-Cre mice (buffer versus rapamycin: mean=12.2% versus 4.6%, difference=7.6%, 95% CI=5.2% to 10.00%, Welch’s t test:P<.001), and relative kidney/body weight ratios of BHDf/+/KSP-Cre control mice (buffer versus rapamycin: mean=0.82% versus 0.88%, difference=0.06%, 95% CI= – 0.11% to 0.24%; Student’s t test:P= .47). Data are represented as means and 95% confidence intervals. G) Buffer-treated BHDf/d/KSP-Cre mouse kidneys have numerous cystic tubules and ducts. Insert indicates higher magnification of area in the square. H) Rapamycin-treated 3-week-old BHD knockout mouse kidneys show fewer, less dilated tubules. Insert indicates higher magnification of area in the square. Scale bar=5 mm. I) Kaplan-Meier survival analysis shows a statistically significant difference between buffer- and rapamycin-treated BHD knockout mice. Median survival time of buffer-treated BHDf/d/ KSP-Cre mice is 23 days (n=5) and rapamycin-treated BHDf/d/ KSP-Cre mice is 41.5 days, (n=4). Log-rank test (two-sided), P=.0065.

