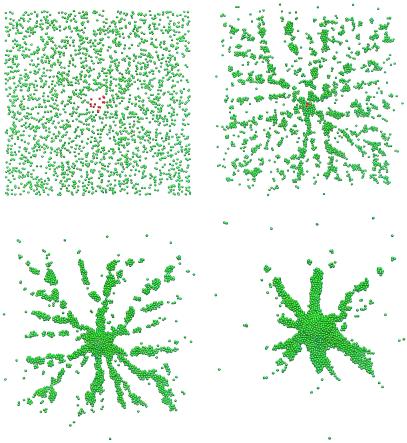
Figure 3.
Time snapshots of the aggregation of Dd cells in response to cAMP signaling from pacemaker cells that are located in the center (red cells). The time for the frames is 0 (Upper Left), 80 (Upper Right), 160 (Lower Left), and 320 min (Lower Right). The total number of cells is 2,500, but the cAMP output of each cell is weighted by 16.

