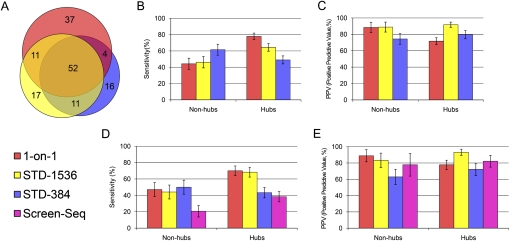
Figure 4.
Comparison of Y2H results. (A) Area-proportional Venn diagram of PPIs found by 1-on-1, STD-1536, and STD-384 (generated by http://venndiagram.tk/). (B) Sensitivity (the percentage of core hits from each method in the whole core set) and (C) positive predictive value (PPV; the percentage of each method's hits that successfully pass pairwise retest and end up in core) of 1-on-1, STD-1536, and STD-384, restricted either to hub baits or to nonhub baits. (D) Sensitivity and (E) PPV of 1-on-1, STD-1536, STD-384, and Screen-Seq, restricting all data sets to the four nonhub and two hub baits screened in Screen-Seq. Error bars indicate standard error.

