Figure 5.
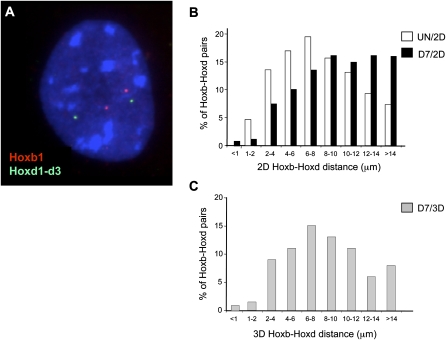
Spatial proximity between Hoxb1 and Hoxd1 loci. (A) Three-color DNA-FISH on DAPI counterstained nucleus from a differentiated (7 d) OS25 ES cell using probe for Hoxb1 (BAC MMP-4; as in Chambeyron and Bickmore [2004]) in red, and fosmid probe for Hoxd1-d3 (WI1-121N10) in green. (B) Histogram showing the distribution of distances between the Hoxb and Hoxd signals measured by 2D FISH in nuclei from undifferentiated and differentiated (7 d) cells (59 and 87 nuclei analyzed, respectively). Distances are slightly larger in differentiated cells due to the increased nuclear volume. (C) As in B but using 3D FISH on pFa fixed cells.

