Figure 6.
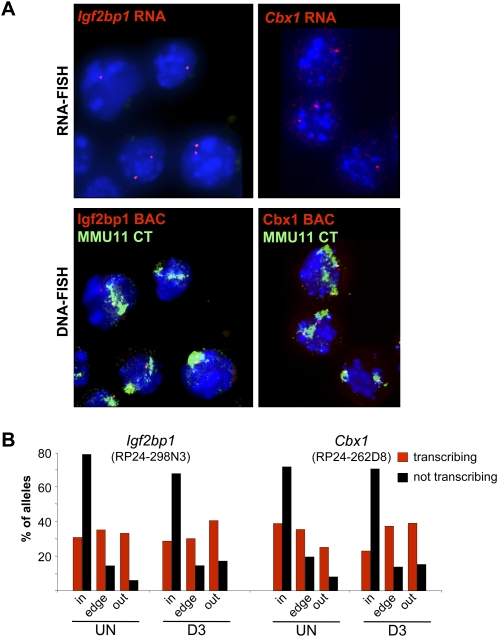
Nuclear organization of actively transcribing alleles. (A) (Top panels) RNA-FISH with Igf2bp1 or Cbx1 intronic probes (red) on DAPI counterstained nuclei of cytospun OS25 ES cells. (Lower panels) Same nuclei after denaturation and DNA-FISH with BAC probes overlapping Igf2bp1 (RP24-298N3) and Cbx1 (RP24-262D8) regions (red) together with an MMU11 chromosome paint (green). (B) Histogram showing the percent of actively transcribing/ RNA-FISH +ve (red) or nontranscribing (black) Igf2bp1 or Cbx1 alleles located inside (in), at the edge (edge), or outside (out) of the MMU11 CT in undifferentiated (UN) OS25 ES cells and in cells differentiated for 3 d (D3). Analysis was confined to cells with at least one RNA-FISH signal. For Igf2bp1 n = 288 and 192, UN and D3, respectively. For Cbx1, n = 320 (UN) and 128 (D3).

