Figure 8.
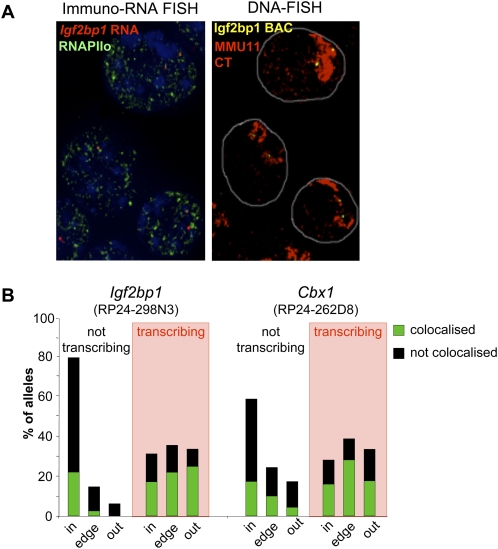
Active vs. inactive allele colocalization with foci of RNAPII. (A) Maximal projection image after deconvolution of 3D RNA-immuno-FISH using an Igf2bp1 intronic probe (red) and an antibody against the phosphorylated form of RNAPII (green) on DAPI counterstained nuclei of undifferentiated OS25 cells (left panel). The DAPI channel has been attenuated in order to improve the visualization of red and green signals. The right panel shows the same nuclei after denaturation and DNA-FISH with a BAC probe encompassing Igf2bp1 (RP24-298N3, yellow) together with an MMU11 chromosome paint (red). (B) Histogram showing the percent of nontranscribing and transcribing (shaded in red) Igf2bp1 or Cbx1 alleles located inside (in), at the edge (edge), or outside (out) of the MMU11 CT together with the percent of alleles colocalized with (green) or distinct from (not associated, black) a phosphorylated RNAPII focus within each category in undifferentiated OS25 cells. n = 288 (not transcribing), 206 (transcribing) for Igf2bp1 and 128 (not transcribing), and 57 (transcribing) for Cbx1.

