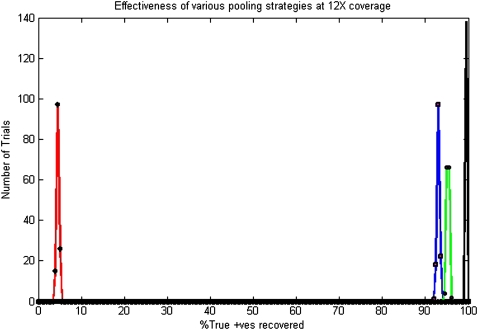
Figure 3.
Distribution of performance at 12×. Color coding indicates red for no pooling, blue for logarithmic designs, green for error-correcting designs, and black for barcoding strategy. Since we are only able to sequence 24 individuals on 24 pools in the absence of a pooling strategy, only ≈5% singleton variants are observed (and consequently recovered). Logarithmic pooling recovers ∼94% singletons, while error-correcting code recovers ∼96% singletons. Barcoding outperforms both pooling strategies, recovering ∼100% singletons in all cases.

