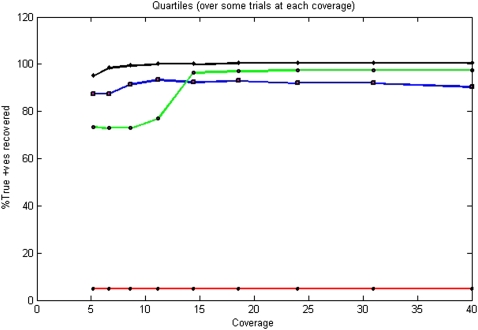
Figure 4.
Performance across coverage. Color coding indicates red for no pooling, blue for logarithmic designs, green for error-correcting designs, and black for barcoding strategy. In the absence of a pooling strategy, since we only observe 24 out of 500 individuals, most variations are missed. The base-8 logarithm signatures perform well throughout since total coverage is only distributed among three pools, giving a high mean-per-pool coverage. Golay error-correcting code performs better than logarithmic code at high coverage despite the coverage being divided among eight pools, with error correction offering better response. However, they suffer declining performance toward the lower end of the spectrum when per-pool coverage becomes unsustainable. Barcoding outperforms the designs under most conditions.

