
Figure 8.
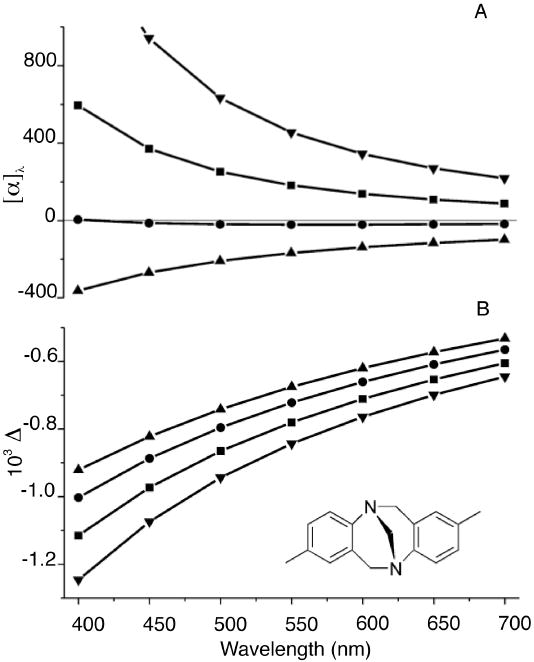
ORD (A) and depolarized right-angle ICP RayOA curves (B) of (+)-(5S, 11S)- Tröger’s base calculated using HF (▲) and DFT with B3LYP (■), BHLYP (●), BLYP (▼) functionals. Calculations used the 6-31G* basis set with the B3LYP/6-311G** optimized geometry. The predicted ORD curves show significant variation depending on the choice of the QM method. In contrast, the RayOA curves are uniformly negative in sign and possess nearly identical curvatures.68