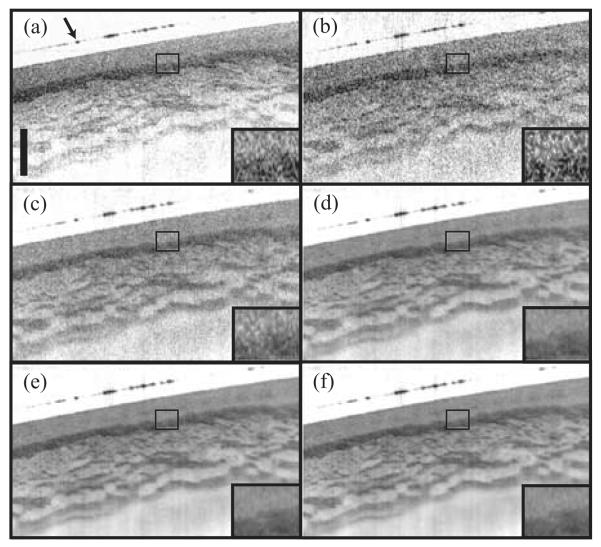
Fig. 6.
Images of porcine esophageal tissue obtained from a conventional OFDI system (a) and from the angle-resolved OFDI system by compounding 1 (b), 4 (c), 16 (d), 64 (e), and 256 (e) angular samples. The scale bar corresponds to 500 μm in depth; the transverse extension of the images is 6 mm. The arrow points to the top surface of the coverslip overlying the tissue.

