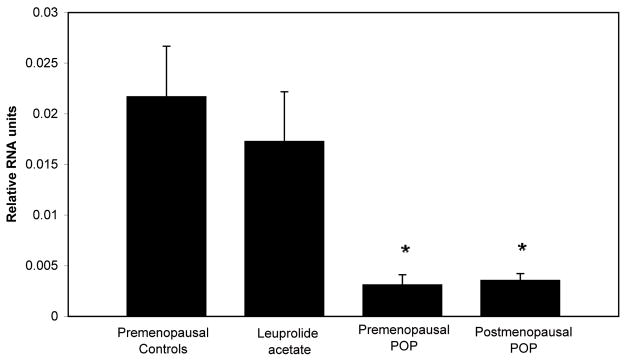
Figure 2. Comparison of HOXA13 mRNA expression in vaginal specimens.
Premenopausal controls n=6, Leuprolide acetate n=5, Premenopausal POP n=20, Postmenopausal POP n=25. Comparisons were made after normalization with beta actin. * indicates that expression of vaginal HOXA13 in groups is significantly different from the expression in the premenopausal controls and from specimens obtained from women treated with leuprolide acetate.

