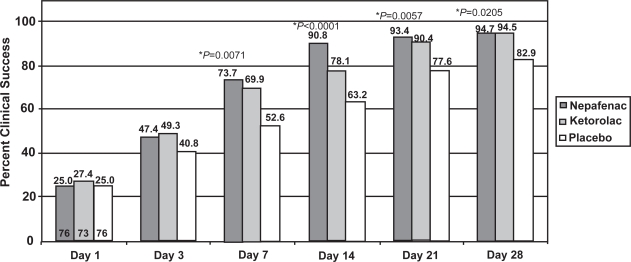
Figure 3.
Clinical success rate of nepafenac 0.1%, ketorolac 0.5%, and placebo at each visit.
*nepafenac 0.1% vs placebo, chi-square test. †nepafenac 0.1% vs ketorolac 0.5%, chi-square test.
Note: The numbers at the bottom of the Day 1 bars represent the number of evaluable patients in each arm. The number of evaluable patients did not vary across time points.

