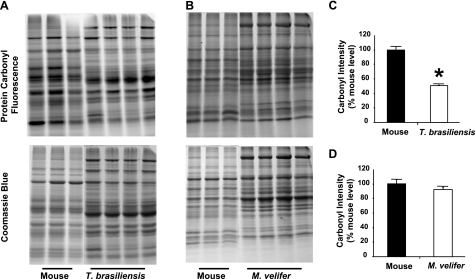
Figure 1.
Protein carbonyl levels are relatively lower in samples from bat species relative to those from mice. A) Representative SDS-PAGE gel showing carbonyl probe fluorescence and total protein as measured by Coomassie blue stain in samples from liver homogenates from house mice and T. brasiliensis. B) As in A, comparing liver homogenates from house mice and M. velifer. C) Relative carbonyl levels for mice (n=3 animals) and T. brasiliensis (n=4 animals), presented as carbonyl intensity (carbonyl fluorescence/total protein as measured by Coomassie blue) relative to average intensity for mice. Bars represent means ± se. *P < 0.01; t test. D) As in C, comparing carbonyl levels for mice (n=3 animals) and M. velifer (n=4 animals).

