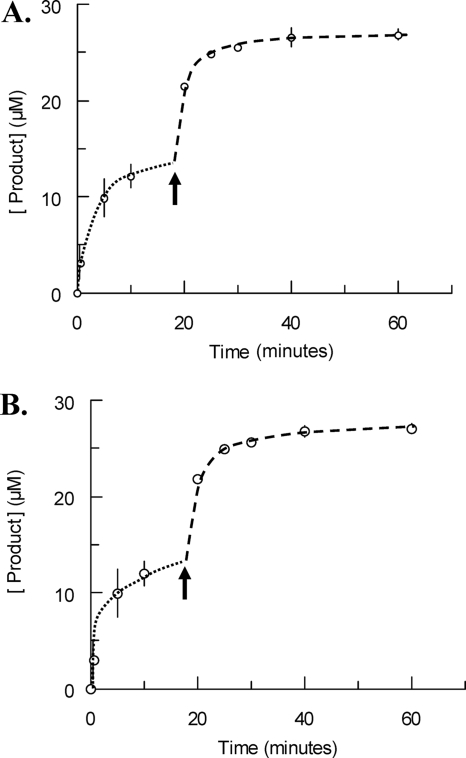
FIG. 5.
Evidence for reversible substrate inactivation. (A and B) Time courses of product formation during the hydrolysis of GlcNAc-anhydroMurNAc-tetrapeptide by sAmiD. In both cases, the initial enzyme concentration was fixed to 106 nM, whereas the initial substrate concentrations were 14 μM and 27 μM, respectively. (A) Fresh substrate (14 μM) was added when 85% of the initial substrate was hydrolyzed; (B) a fresh enzyme solution (106 nM) was added after the burst. The arrows indicate the times of addition of fresh substrate (A) or enzyme (B). Each value represents the mean of the results of three determinations. The dotted and dashed lines highlight the two steps of the experiment. See the text for details.

