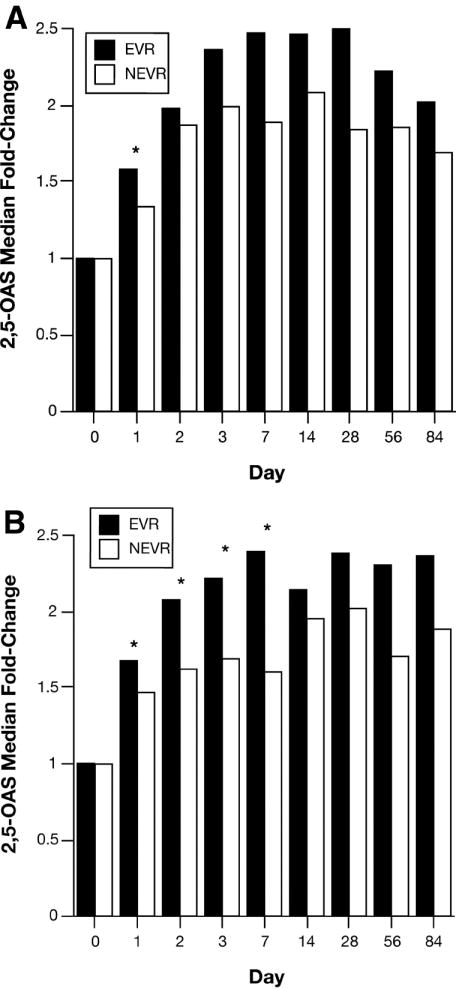
Figure 5. Serum 2,5-OAS fold-change and EVR in AA (A) and CA (B) patients.

Serum 2,5-OAS concentrations were measured by RIA as described in Materials and Methods. Data expressed as fold change on each day relative to day 0 as described in figure 2. The EVR was defined as in figure 4 and in Materials and Methods. Results were compared between EVR and NEVR using the Wilcoxon rank-sum.
