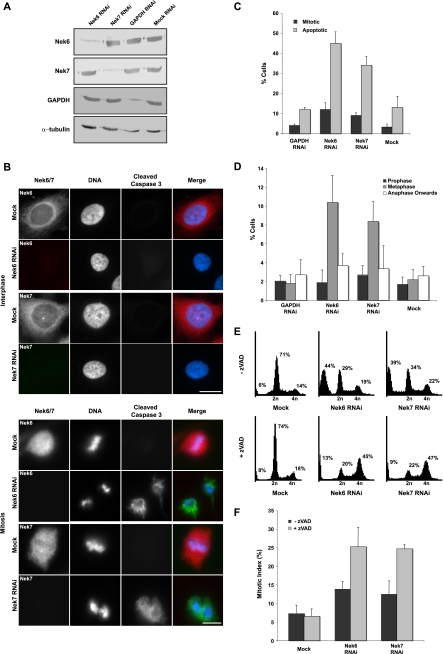
FIG. 5.
RNAi depletion of Nek6 or Nek7 induces apoptosis following mitotic arrest. (A) HeLa cells were either mock transfected or transfected with siRNA oligonucleotides targeted against Nek6, Nek7, or GAPDH. After 72 h, extracts were prepared and analyzed by SDS-PAGE and Western blotting with Nek6, Nek7, GAPDH, or α-tubulin antibodies. (B) HeLa cells were transfected with siRNA oligonucleotides, as indicated, for 72 h before being fixed and analyzed by immunofluorescence microscopy with antibodies against Nek6 or Nek7 (red on merge) and cleaved caspase 3 (green on merge). DNA was stained with Hoechst 33258 (blue on merge). Cells in interphase and mitosis are shown. Scale bar, 10 μm. (C) HeLa cells were treated with siRNA oligonucleotides for 72 h, as indicated, and analyzed as described in the legend for panel B. A total of 100 to 300 cells were scored for mitosis or apoptosis in three independent experiments, and means (±standard deviations) are indicated. (D) Following treatment of cells with siRNA oligonucleotides, as indicated, the frequencies of cells in different stages of mitosis were scored. Data represent means (±standard deviations) from three separate experiments, counting at least 100 cells per experiment. (E) HeLa cells were transfected with Nek6 or Nek7 siRNA oligonucleotides or mock transfected for 72 h in the presence or absence of 100 μM zVAD, as indicated. Cells were then harvested and fixed before being stained with propidium iodide and before the cell cycle distribution being analyzed by flow cytometry. The percentages of cells in less than 2n, 2n, and 4n peaks are indicated. (F) HeLa cells were transfected with Nek6 or Nek7 siRNA oligonucleotides or mock transfected for 72 h in the presence or absence of zVAD before being fixed and analyzed by immunofluorescence microscopy, and the frequencies of cells in mitosis were scored. Data represent means (±standard deviations) from three separate experiments, counting at least 100 cells in each.

