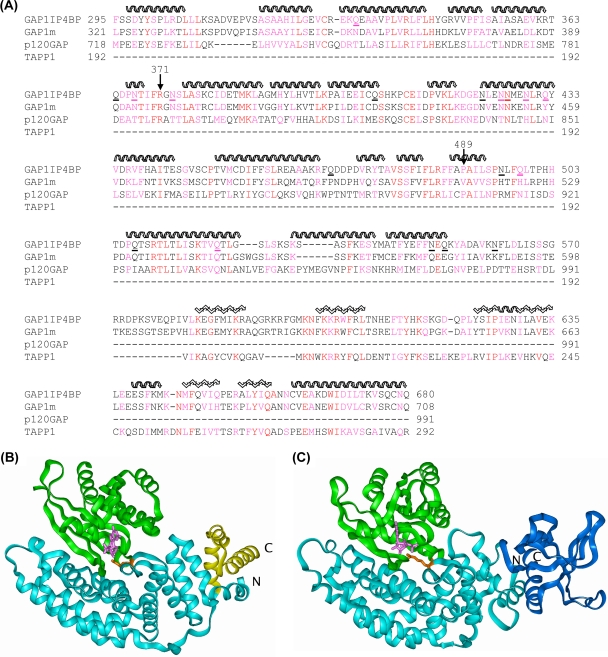
FIG. 5.
Molecular modeling of the RasGRD of GAP1IP4BP. (A) The sequence alignment used for modeling of GAP1IP4BP and GAP1m on p120GAP (GRD 1WER) and TAPP1 (PH domain 1EAZ). The secondary structure of the templates is indicated as follows: helix, wavy overlining; sheet, zigzag overlining. Residue identities are in red, and similarities are in magenta. The asparagine and glutamine residues in GAP1IP4BP that were mutated to alanine are underlined. (B) Structure of the Ras/p120GAP complex (1WQ1). The p120GAP GRD is shown as a light blue ribbon with the residues beyond L991 shown in yellow. Ras is shown as a green ribbon, GDP is shown as pink sticks, and R789 is shown as orange sticks. (C) Model of the Ras/GAP1IP4BP complex. The GAP1IP4BP GRD (modeled on p120GAP) is shown as a cyan ribbon with the residues beyond E573 shown in dark blue and modeled as a PH domain. Ras is shown as a green ribbon, GDP is shown as pink sticks, and R371 is shown as orange sticks.

