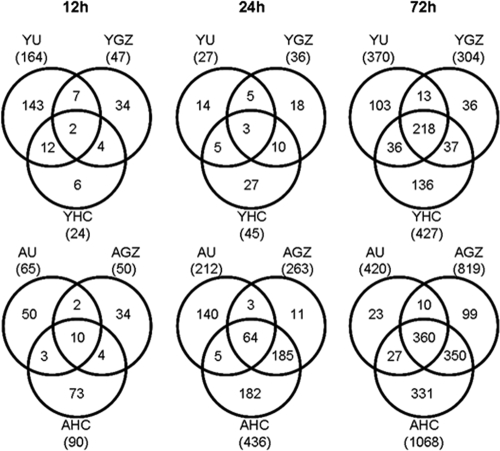
FIG. 5.
Viruses show more similar profiles of differentially expressed genes as time progresses. The Venn diagram shows the overlap of genes with ≥2-fold change (P ≤ 0.01) between icUrbani, icGZ02, and icHC/SZ/61/03 in young and aged mice over time. Data are presented for young (Y) and aged (A) mice infected with either icUrbani (U), icGZ02 (GZ), or icHC/SZ/61/03 (HC) at the indicated time points p.i. The numbers in the centers were shared by all three viruses.

