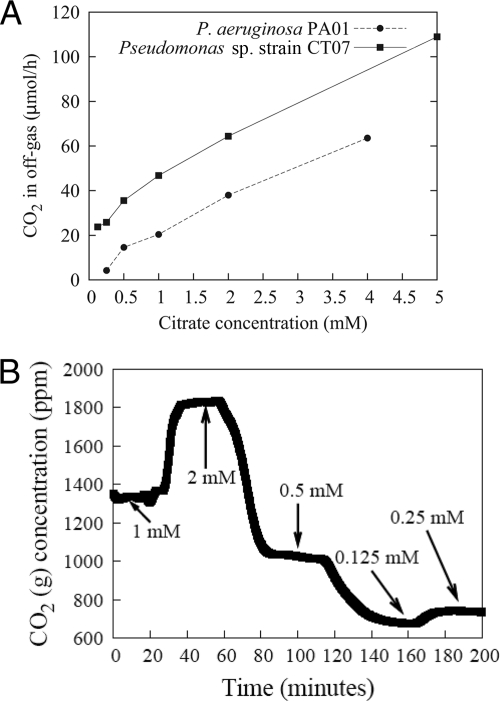
FIG. 3.
CO2 production rates showing biofilm response to changes in influent citrate concentrations. Biofilm metabolic response showing the linear correlation (an R2 value of 0.995 and 0.996 for P. aeruginosa PAO1 and Pseudomonas sp. strain CT07, respectively) (A) with citrate concentration despite the random order (Pseudomonas sp. strain CT07 in this case) (B) in which the concentration was changed, demonstrating the adaptability of biofilms to environmental changes.

