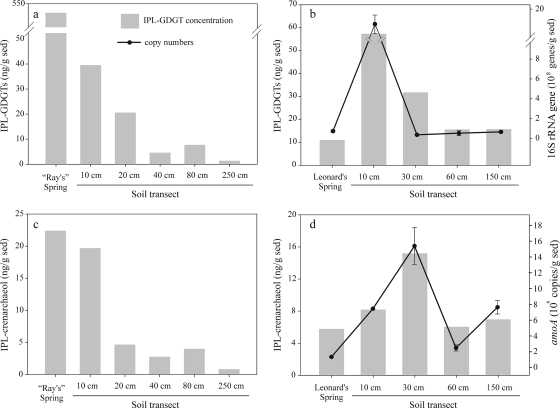
FIG. 3.
Total archaeal IPL-GDGTs (a and b) and IPL-crenarchaeol (c and d) from “Ray's” hot spring and Leonard's hot spring as well as the corresponding soil transects, shown as bars. Archaeal 16S rRNA (b) and archaeal amoA (d) gene copy numbers measured by quantitative PCR from Leonard's site are shown as marked lines, with error bars (in some cases smaller than the symbol size) representing the standard deviations of copy numbers obtained from triplicate qPCR reactions.

