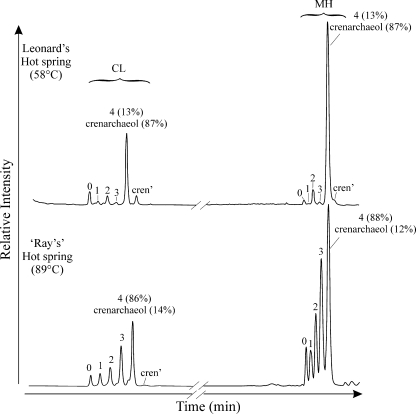
FIG. 4.
HPLC-APCI-MS base peak chromatograms of total Bligh-Dyer extracts showing the relative abundances of CL- and MH-GDGTs in each hot spring. Peak numbers and labels correspond to GDGT structures shown in Fig. 1 (e.g., “0” is GDGT-0). Numbers in parentheses next to GDGT-4 and crenarchaeol indicate the percent composition each in the labeled peak where these GDGTs coelute.

