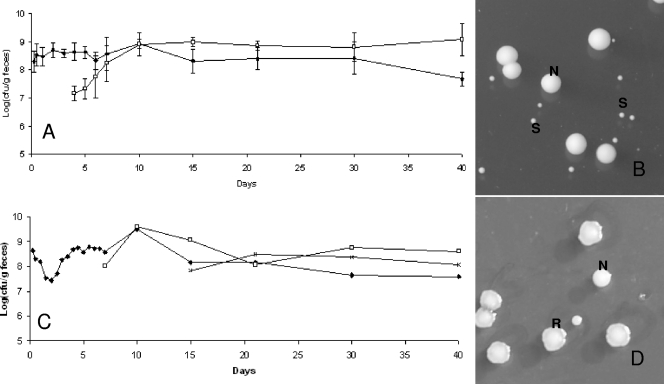
FIG. 2.
Implantation of L. sakei in the GITs of axenic mice and appearance of a subpopulation. (A) Counts of L. sakei 23K (black symbols) at different time points are shown. White symbols represent a subpopulation showing an S colony morphology. Data are the means of the cell counts obtained by plating feces excreted by four mice. Error bars indicate standard deviations. (B) L. sakei S and N colony morphotypes on MRS plates. (C) Counts of the original L. sakei LTH5590 strain (black symbols) and the appearance of two subpopulations characterized by S (white symbols) and R (multiplication signs) colony morphologies. The R population appeared in only some mice. (D) An example of the R population in one mouse is shown. The image shows an L. sakei LTH5590 R colony morphotype on MRS medium.

