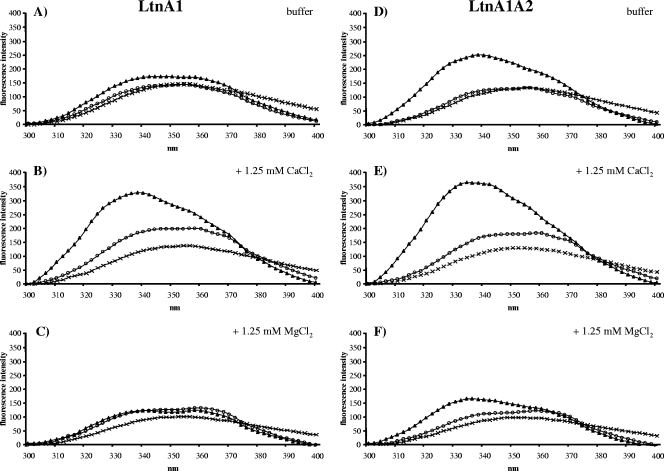
FIG. 4.
Fluorescence emission spectra of LtnA1 (0.25 μM) (A to C) and LtnA1/A2 (0.25 μM each) (D to F) (crosses) in the presence of vesicles (100 μM lipid Pi) made of DOPC (open circles) and DOPC with 1 mol% lipid II (triangles) in buffer (A and B) containing 1.25 mM Ca2+ (C and D) and 1.25 mM Mg2+ (E and F), respectively.

