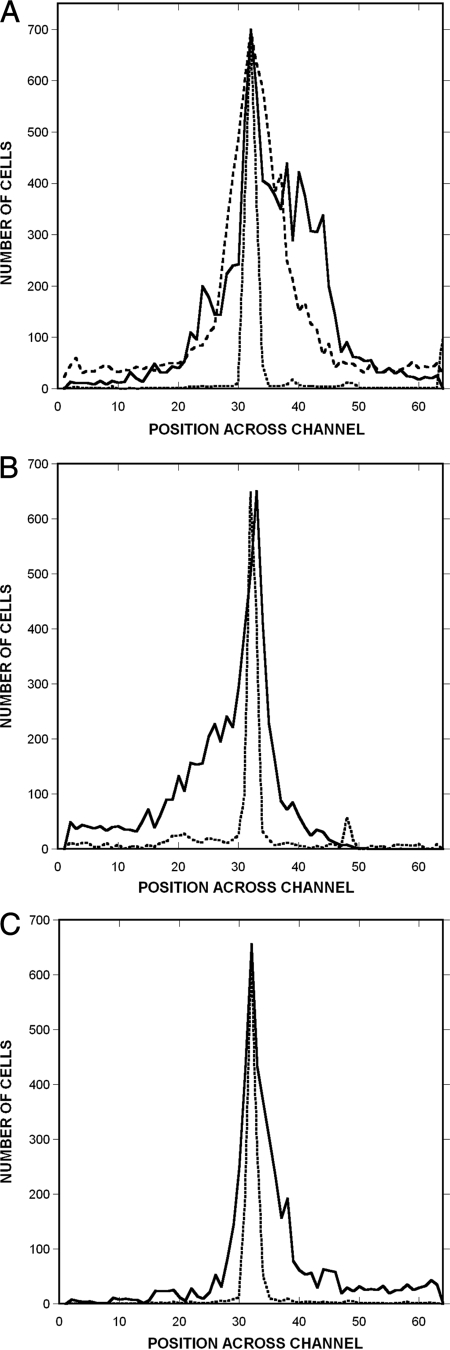
FIG. 5.
Migration profiles in response to gradients of potential chemoeffectors. (A) Spatial distribution of RP437 cells from one of three representative experiments in gradients of 0 to 500 μM AI-2 and 0 to 500 μM DMSO. The distribution of dead cells is shown with a dotted line, the distribution of living cells in the AI-2 gradient is shown with a solid line, and the distribution of living cells in the DMSO gradient is shown with a dashed line. (B and C) Distribution of cells in gradients of 0 to 500 μM indole (B) and 0 to 250 μM isatin (C). The distribution of dead cells is shown with a dotted line, and the distribution of living cells is shown with a solid line. Data were collected and analyzed as described in the legend of Fig. 4.

