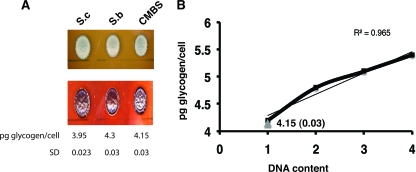
FIG. 5.
(A) Glycogen levels in the S. cerevisiae (S.c), S. bayanus (S.b), and CMBS-33 strains. Cells were plated on YEP-dextrose (top panel) and stained with crystal violet (bottom panel). The levels of glycogen per cell are shown below the panels. Standard deviations (SD) were obtained from the results of three independent experiments. (B) Glycogen levels in isogenic polyploid strains of S. cerevisiae (thick black line). The level of glycogen in CMBS-33 is illustrated by a gray triangle. Thin black line, linear trend line.

