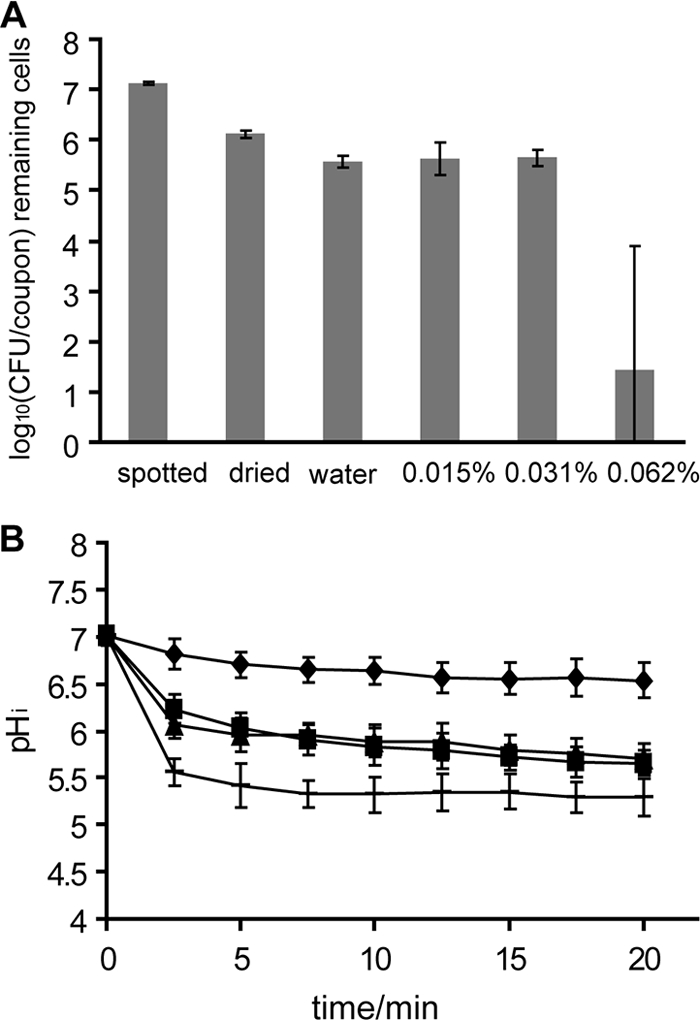
FIG. 6.

Viable-cell counts (A) and pHi (B) of Listeria monocytogenes N53-1 grown, spot inoculated, and dried in TSB with 1% glucose during treatment with water (⧫) or 0.015% (▪), 0.031% (▴), or 0.062% ( ) Incimaxx DES. The viable-cell counts are averages of triplicate determinations. Error bars are based on standard deviations from the triplicate determinations. pHis are averages based on at least 40 single cells, and error bars indicate population variation. The results are representative of two independent experiments.
