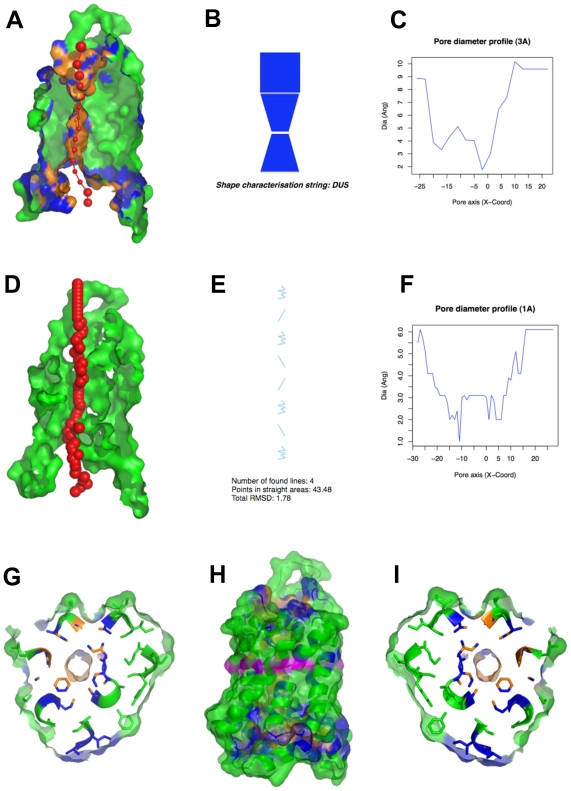
Figure 3. PoreWalker output for the bovine aquaporin-1 water channel (1j4n).
(A) visualization of a pore section showing pore-lining residues and pore centres at 3Å steps: the section of the structure was obtained by cutting the protein structure along the xy-plane, where the x-axis corresponds to the pore-axis, and y-coordinate>0 only are displayed. Pore-lining atoms and residues are coloured in orange and blue, respectively. The remaining part of the protein is shown in green. Red spheres represent pore centres at given pore heights and their diameters correspond to 1/10 of the pore diameter calculated at that point; (B) representation of the shape of the pore and shape characterization string: the pore is simplified as a stack of building blocks going from the most negative to the most positive coordinate along the pore axis (x-axis). D, U and S indicate conical frustums of decreasing diameter, conical frustums of increasing diameter and cylinders, respectively; (C) pore diameter profile at 3Å steps corresponding the pore shape in (B). Pore axis (X-Coord): the position along the pore axis is shown as x-coordinate in Å. Dia (Ang): pore diameter value in Å; (D) visualization of a pore section showing the position of the biggest spheres (pore centres) that can be built along the channel at 1Å steps: the section of the structure was obtained by cutting the protein structure along the xy-plane. The protein structure is coloured in green; (E) diagram of the regularity of the pore cavity as number of lines that can approximate the positions of the pore centres at 1Å steps (PRINCIP). The pore is represented as a series of consecutive straight and wiggly lines representing channel areas where pore centres can (straight) or cannot (wiggly) be fitted to a line, going form the most negative to the most positive coordinate along the pore axis (x-axis). Vertical lines describe either the only low-RMSD areas throughout a pore or low-RMSD areas that are co-linear. Diagonal lines represent low-RMSD areas, which are different from the low-RMSD areas other identified along the channel. Curve lines indicate areas where pore centres are highly spread; (F) pore diameter profile at 1Å steps. Pore axis (X-Coord): the position along the pore axis is shown as x-coordinate in Å. Dia (Ang): pore diameter value in Å; (G)–(I) horizontal sections of the pore at the pore height highlighted in purple in (H) viewed from the bottom, i.e. the most negative coordinate along the pore axis (G) and from the top, i.e. the most positive coordinate along the pore axis (I).

