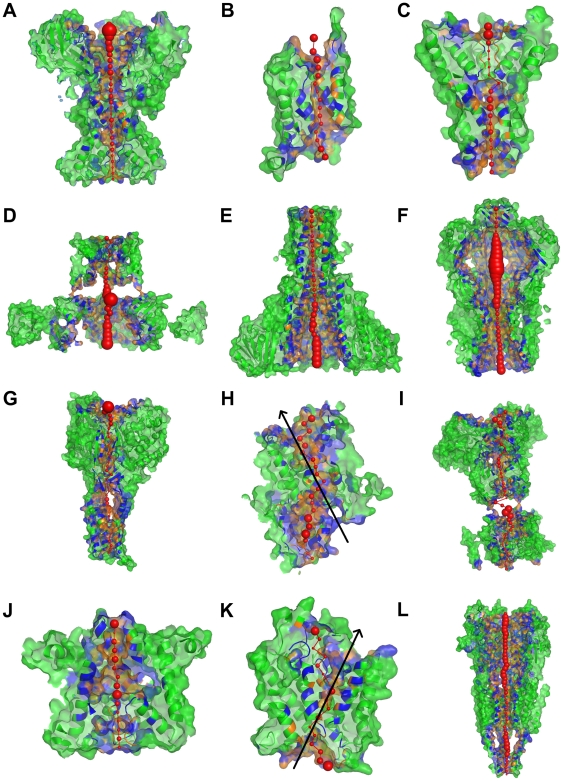
Figure 4. PoreWalker visual representations.
Images show xz-plane sections, z-coordinate>0 only, with the x-axis corresponding to the pore axis. (A) KirBac1.1 potassium channel (1p7b); (B) bovine aquaporin-1 (1j4n); (C) KcsA potassium channel (1k4c); (D) MthK calcium-gated potassium channel (1lnq); (E) CorA Mg2+ transporter (2iub); (F) MscS voltage-modulated mechanosensitive channel (2oau); (G) ASIC1 acid-sensing ion channel (2qts); (H) SecYE-beta protein-conducting channel (2yxr); (I) Kv1.2 voltage-gated potassium channel (2a79); (J) sodium-potassium channel (2ahy); (K) Amt-1 ammonium channel (2b2f); (L) nicotinic acetylcholine receptor (2bg9). Pore-lining atoms and residues are coloured in orange and blue, respectively. The rest of the protein is shown in green. Red spheres indicate pore centres at 3Å steps and their size is proportional to the pore diameter in that point. Black arrows indicate the main pore axis as identified by visual analysis of the structure.

