Fig. 2.
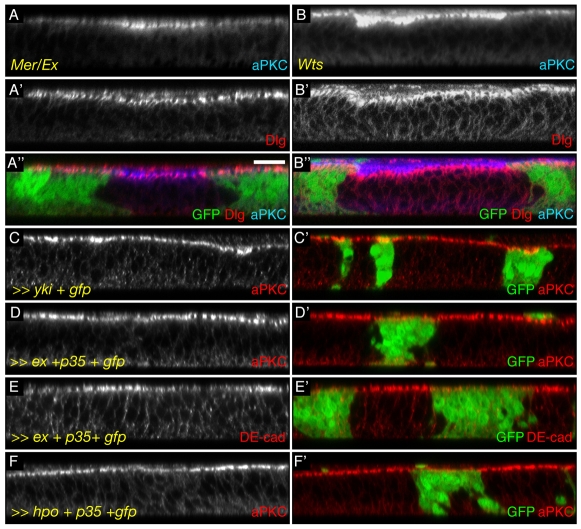
Inactivation of Hpo pathway members induces apical protein accumulation. (A-F′) Transverse sections of wing discs. Scale bar: 10 μm. (A″,B″) Merged images of A,B, A′,B′, respectively and of GFP. C′-F′ Merged images of C-F with GFP (green). Grey or red: stainings for aPKC (C-D′,F,F′) or for DE-cad (E,E′). (A-A″) Cells mutant for mer;ex show an increase in the apical markers aPKC (grey in A, blue in A″) but not of the lateral marker Dlg (grey in A′, red in A″). (B-B″) Similarly, wts mutant cells show an increase in aPKC (grey in B, blue in B″) but not in Dlg (grey in B′, red in B″). (C,C′) Mimicking Hpo pathway inactivation by overexpressing yki also leads to an increase in apical aPKC (cells marked by GFP). (D-F′) Activating the Hpo pathway, by overexpressing the caspase inhibitor p35 and either ex (D-E′) or hpo (F,F′), leads to a reduction in apically localised aPKC (D,D′,F,F′) or DE-cad (E,E′) (cells marked by GFP).

