Fig. 3.
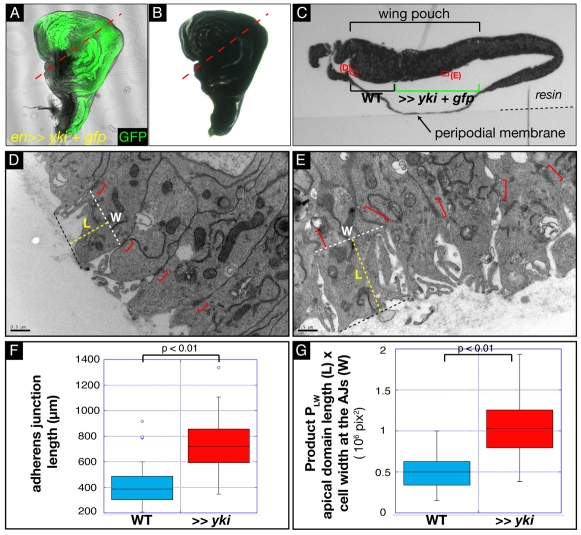
Correlative transmission electron microscopy of yki-overexpressing wing imaginal cells reveals apical membrane hypertrophy. (A) Transmitted light and GFP merged image of a third instar wing disc overexpressing Yki under the engrailed promoter. The disc was attached to an etched grid coverslip to stabilise its shape. (B) Same disc as in A now resin-embedded and prepared for TEM. The disc retains its gross morphology, allowing us, by comparing A and B, to distinguish the yki-overexpressing cells (green in A) and the WT cells. The dotted red line indicates the transverse section shown in C. (C) Semi-thin transverse section of the en>>yki disc, viewed in transmitted light. The different features of the discs, such as the peripodial membrane and the pouch, are distinguishable. By comparing A,B and C, it is possible to locate the position of WT and yki-overexpressing cells. The red rectangles indicate the position of the higher magnification images shown in D and E. (D,E) High magnification micrographs of control cells (D) and of yki-overexpressing cells (E). Scale bar: 0.5 μm. The AJs are indicated by red brackets. The white dashed lines indicate the width at the AJs (W). The yellow dashed lines give a measure of apical domain length (L). The product PLW of L×W gives an indication of relative apical domain size. (F) Box and whisker plot of AJ measurements. The P-value from a Mann-Whitney test is indicated. (G) Box and whisker plot of relative apical domain size, assessed by calculating the PLW product. The P-value from a Mann-Whitney test is indicated.

