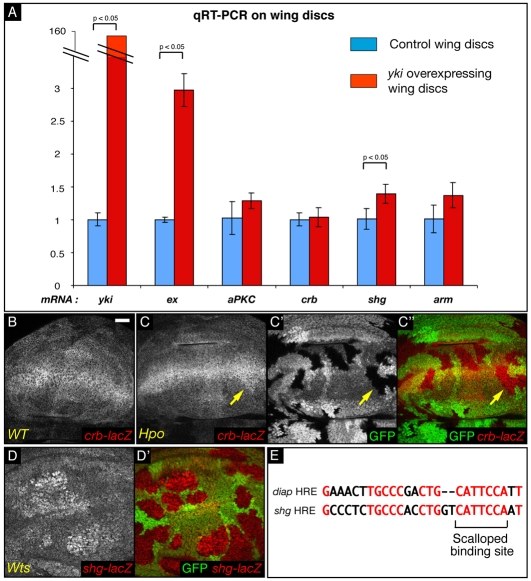
Fig. 4.
Transcriptional regulation of polarity genes in loss-of-function clones for the Hpo pathway. (A) Graph of mRNA levels of different polarity genes measured by qRT-PCR in yki-overexpressing and WT discs. (B-D′) XY sections of third instar wing discs. Scale bar: 20 μm. C″ is a merged image of C (red) and C′ (green). D′ is a merged image of D with that of GFP (green). Grey or red: anti-β-galactosidase staining. Compared with WT cells (A), hpo mutant cells (B,B′), do not show an overall change in β-gal staining (monitoring crb-lacZ activity). A weak increase could occasionally be observed close to the dorsoventral boundary (arrow). By contrast, wts cells (C,C′) show a marked increase in shg-lacZ staining. (E) Alignment between the Hippo response element (HRE) identified in the DIAP1 locus (Wu et al., 2008) and a putative HRE found in the first intron of the shg gene (positions 369-395). The Scalloped binding site is indicated. Conserved nucleotides are shown in red.

