Fig. 6.
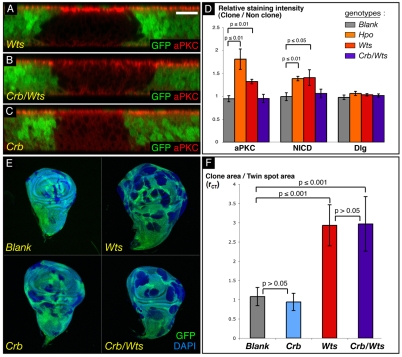
The Hpo pathway controls proliferation independently of cell polarity. (A-C) Transverse sections of wing imaginal discs containing mutant clones of different genotypes (marked by absence of GFP) and stained for aPKC. Scale bar: 10 μm. Cells mutated for wts show an increase in aPKC staining (A), whereas cells mutant for crb show less apical aPKC (C). As for crb mutant cells, crb/wts cells have less aPKC on their apical surface (B). (D) Quantification of the apical determinant accumulation in hpo or wts mutant cells, as well as its rescue in crb/wts mutant cells, compared with WT cells. Histogram of the ratio of staining intensities for aPKC, NICD and Dlg between clones of WT, hpo, wts or crb/wts cells, and non-mutant cells of the same wing disc. P-values from Mann-Whitney tests are shown on the graph. (E,F) Quantification of the proliferative advantage of wts, crb and crb/wts mutant cells compared with WT cells. (E) Sample of wing discs used to measure and compare the clonal (absence of GFP) and twin spot areas (two copies of GFP); DAPI (blue) is used to visualise disc outlines. (F) Graph of rCT ratio between clonal and twin spot areas, for each genotype. Blank clones are clones of WT cells. P-values from Mann-Whitney tests are shown on the graph.

