Fig. 4.
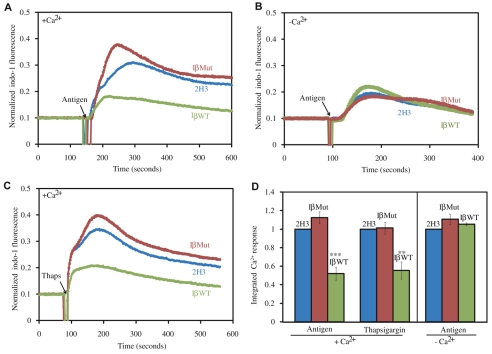
Ca2+ responses for 2H3, IβWT and IβMut cells. (A) Traces show representative Ca2+ responses for 2H3, IβWT and IβMut cells stimulated with 0.2 μg/ml antigen as indicated. (B) Traces show representative Ca2+ responses for 2H3, IβWT and IβMut cells stimulated with 0.2 μg/ml antigen in the absence of extracellular Ca2+. (C) Traces show representative Ca2+ responses for 2H3, IβWT and IβMut cells stimulated with 0.25 μM thapsigargin. (D) Quantification of Ca2+ responses for 2H3, IβWT and IβMut. Ca2+ responses in the presence of extracellular Ca2+ were integrated for 500 seconds, and results from six independent experiments were averaged. ***P<0.001 for IβWT cells compared with 2H3 cells in the presence of antigen. **P<0.005 for IβWT cells compared with 2H3 cells in the presence of thapsigargin. Ca2+ responses in the absence of extracellular Ca2+ were integrated for 300 seconds, and results from five independent experiments were averaged. Bars represent responses relative to that for 2H3 cells, and error bars show s.e.m.

