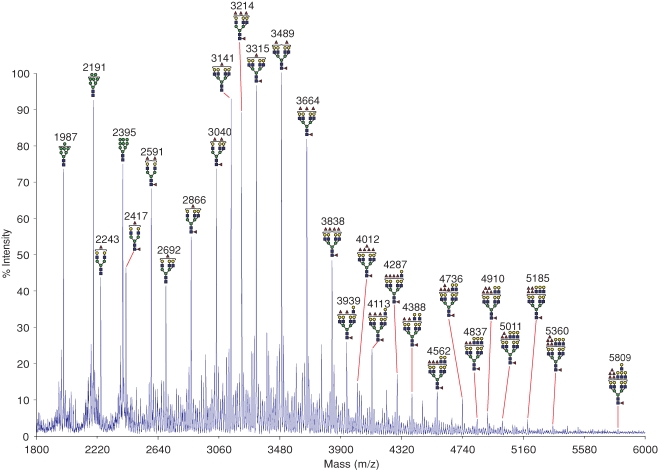
Fig. 4.
Mass spectrometric analysis of N-glycans from CD98hc. Glycans released from purified GalMBP ligands were permethylated and subjected to MALDI MS profiling. All labeled molecular ions corresponding to complex-type glycans were subjected to MS/MS analysis. The assignment for each ion represents the most likely structure based on the precise fit between the calculated composition and the m/z value, taking into account the biosynthetic pathways of N-glycosylation in addition to the MS and MS/MS data. Values (m/z) listed correspond to 12C throughout. Satellite peaks surrounding major signals are either artifacts of the permethylation process or are minor glycans with one or more sialylated antennae. The symbols are defined in Figure 1.

