Fig. 4.
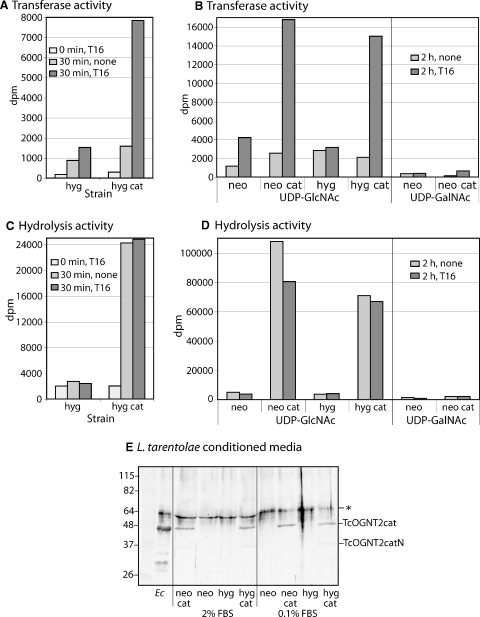
Secretion of TcOGNT2cat in conditioned media. (A) Conditioned media from cultures of L. tarentolae grown in 2% FBS were concentrated 50-fold by centrifugal ultrafiltration and assayed for 0 or 30 min at 22°C for the transfer of 3H from UDP-[3H]GlcNAc to 0 or 200 μM T16 peptide. hyg, L. tarentolae transfected with empty hyg-resistance plasmid; hyg cat, cells transfected with TcOGNT2cat. (B) Similar assay of independent 50-fold concentrated samples of L. tarentolae grown in 0.1% FBS, assayed for 0 or 2 h. neo, L. tarentolae transfected with empty neo-resistance plasmid; neo cat, cells transfected with TcOGNT2cat. (C and, D) The same reactions described in panels A–B were assayed in tandem for conversion of 3H of UDP-[3H]GlcNAc into a neutral species (hydrolysis). Note different ordinate scales. (E) Western blot analysis of samples analyzed in panels A and B. Concentrated conditioned media from cells grown in 2% or 0.1% FBS were probed using a 1:500 dilution of anti-TcOGNT2cat (bleed 5). Ec, soluble fractions from E. coli expressing His6TcOGNT2cat. The position of TcOGNT2cat and that of a nonspecific band (*) not recognized by a later antiserum bleed (Figure 7A) are indicated at the right. A faint lower Mr band in the TcOGNT2cat expressing cells represents a C-terminal breakdown product (see Figure 7). Mr standards with values in kD are shown at the left. The results are representative of three independent experiments.

