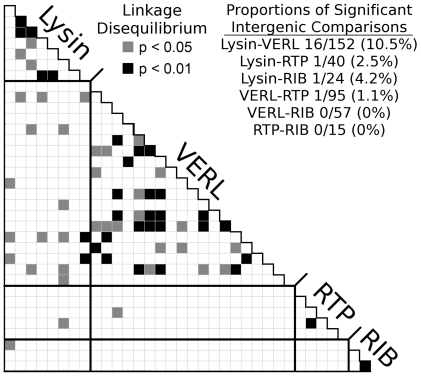
Figure 2. Linkage disequilibrium between tagSNPs in lysin and VERL.
A triangle plot shows the significance of linkage disequilibrium (LD) within and between genes in the pink abalone. Non-reproductive genes (RTP and RIB) were included as negative controls. We considered only a set of tag SNPs with minor allele frequencies of 5% or greater. As expected, there is a large amount of intragenic LD and little between physically unlinked SNPs (intergenic). However, there is a significant excess of LD between lysin and VERL (P = 0.0041, binomial test).

