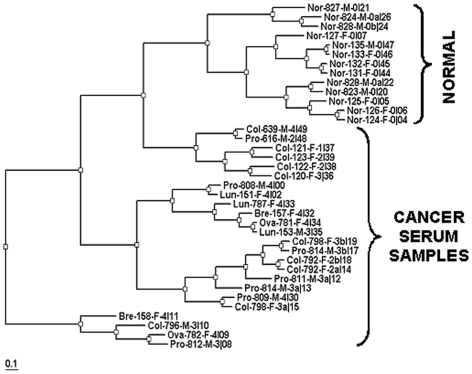
Figure 5. Hierarchical clustering of microarray data (Spearman).
Cancer samples and normal donor samples (brackets) were clustered using a hierarchical clustering program to show sample-to-sample relationships. Sample labels include donor condition (cancer type or normal), sample lot number (last three digits), gender, and cancer stage (2 – 4, or 0 for normal). Labels marked with a or b indicate repeat testing of the same sample.

