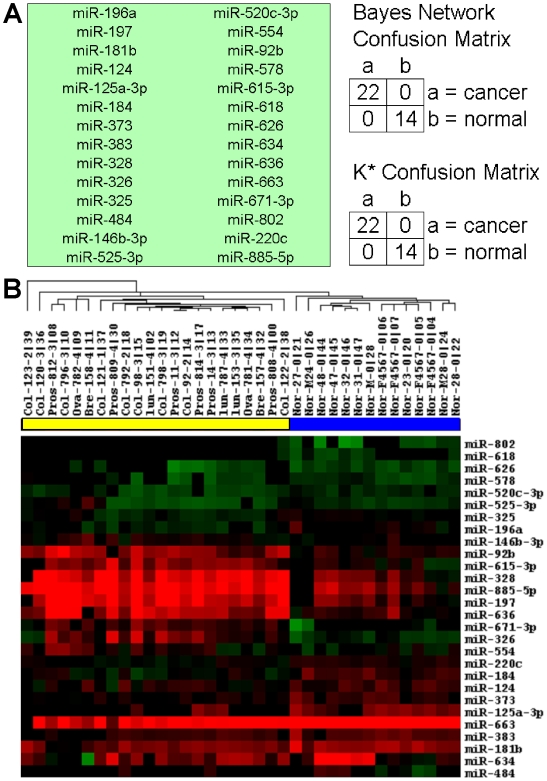
Figure 7. Cancer vs. Normal Classifier.
Data Mining was performed using the WEKA package [13]. miRNA probes (attributes) were chosen using an attribute selection routine called CfsSubsteEval. (A) 28 miRNAs were found using this method. Two distinct classifier methods, both the Bayes network implementation and K* methods [14] were able to correctly classify these samples (using 10-fold cross-validation). The results for both classifier runs are displayed as a confusion matrix on the right. (B) Hierarchical clustering of normal and cancer samples was performed using signal from these 28 miRNAs. Red blocks are highly expressed, green are considered down-regulated and black blocks are non-significant as judged by PM/MM criteria described in the text. Samples are identified as either normal (blue bar) or cancer (yellow bar) at the top of the figure. miRNA names are listed to the right and sample identifications are listed above.

