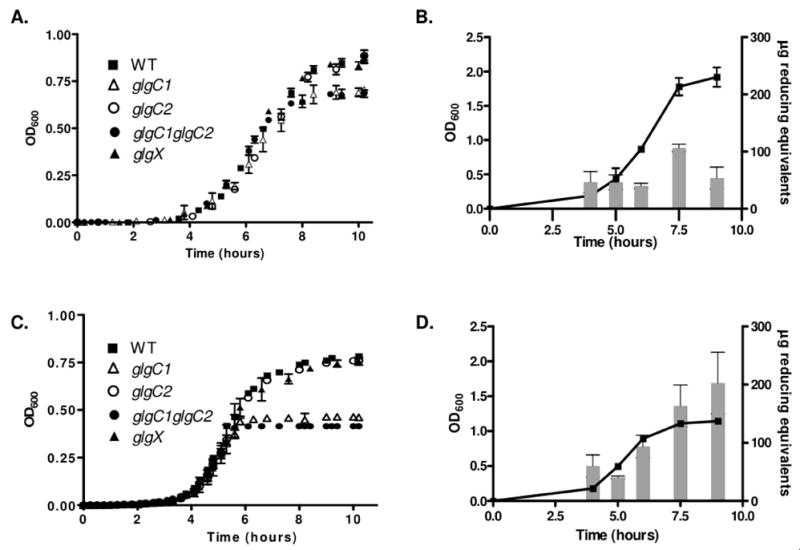
Figure 4. Glycogen storage mutants exhibit growth defects during growth under high and low nitrogen conditions, corresponding to the period in the growth curve when glycogen accumulates.

(A,C) Growth of WT, glgC1, glgC2, glgC1 glgC2 and glgX in M9-glucose in the presence of high nitrogen (A) or low nitrogen (C). Samples were grown at 37°C in M9-glucose with high or limiting ntirogen and the OD600 of each sample was read every 20 minutes for 10 hours. All samples were analyzed in triplicate. The mean OD600 and standard deviation at each time point from a representative experiment are shown. (B, D) Glycogen was assayed in WT V. cholerae during growth in M9-glucose in the presence of high (B) or low nitrogen (D). At each of the indicated time-points, samples were removed and the glycogen content was determined using the enzymatic hydrolysis assay. All samples were analyzed in triplicate. The mean and standard deviation of a representative experiment is shown.
