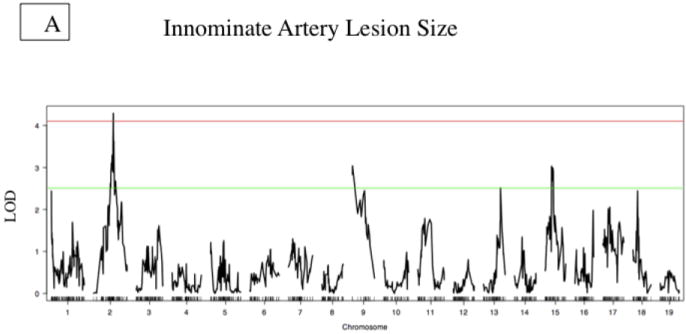
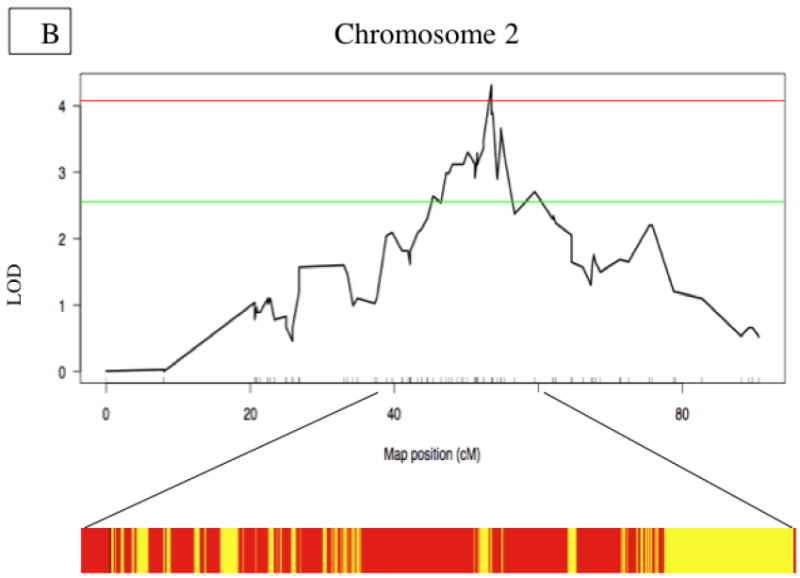
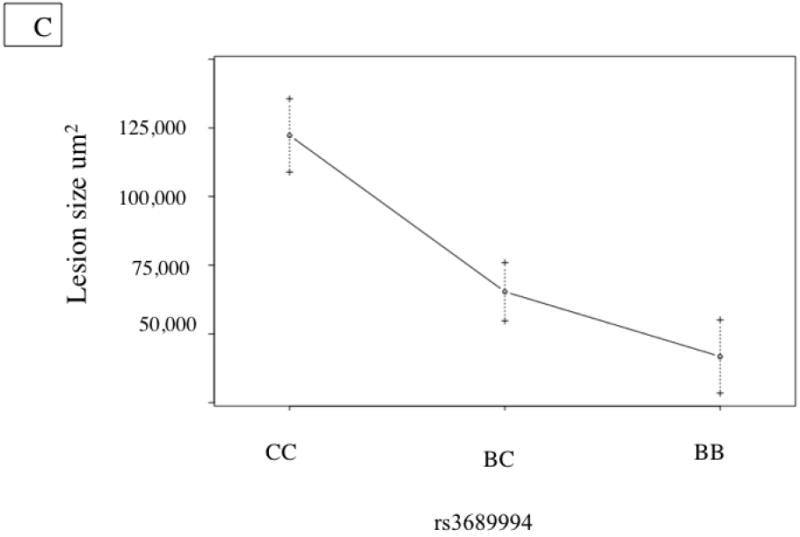
Figure 2. Innominate Artery Lesion Size QTL.


A. Whole genome LOD score plots for Lesion Size in the innominate artery. Red line denotes significance threshold (p<0.05) and the green line denotes suggestive threshold (p<0.63) as determined by permutation testing. B. QTL plot for chromosome 2 locus (top). Bars indicate 85% CI of the QTL. Regions that are identical by descent between C57BL/6J and C3H are shaded yellow and regions of unshared genotypes are shaded in Red. C. The allele distributions for the innominate lesion size locus. CC= C3H homozygotes, BC=heterozygotes, BB=C57BL/6J homozygotes
