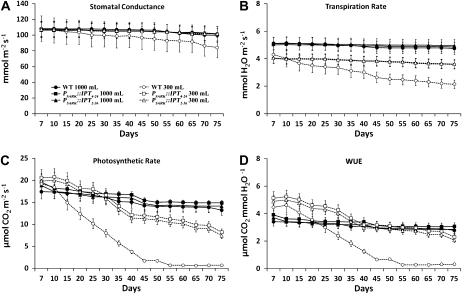
Figure 1.
Comparison of photosynthetic parameters in wild-type plants (WT) and two transgenic lines expressing PSARK∷IPT measured over 75 d of growth under optimal conditions (1,000 mL d−1; black symbols) or reduced watering conditions (300 mL d−1; white symbols). The eighth fully expanded leaf was used for measurements using a LI-6400 gas-exchange system with a fixed chamber CO2 concentration and light and temperature as described in “Materials and Methods.” Values are means ± se (n = 15).

