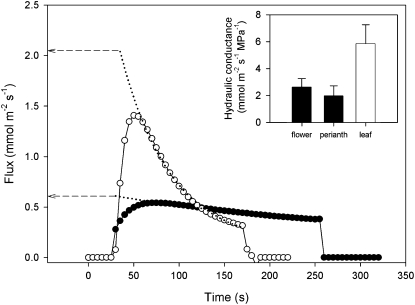
Figure 2.
Representative flow kinetics after a standard step application of 0.3 MPa hydraulic driving force to an excised leaf (white circles) and flower perianth (black circles). Exponential decay curves (dotted lines) were fitted to the data to allow reconstruction of peak flow at connection (time zero). Hydraulic conductance was calculated by dividing peak flow by the initial pressure gradient. Mean hydraulic conductance (inset) of whole flowers and the perianth only (black bars) was about one-third that of individual leaves (white bar). The drop in flow for each of the samples occurred when the samples were removed from the flow meter. Error bars denote sd.

