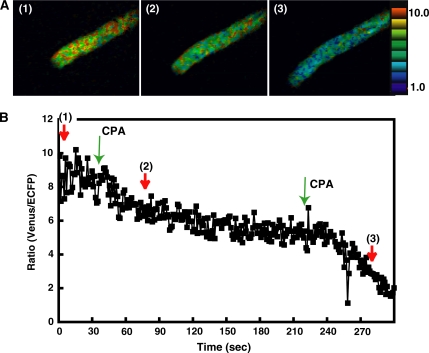
Figure 9.
The effect of CPA on the [Ca2+]ER in Arabidopsis pollen tubes growing in the semi-in vivo condition. A, Ratio images of the ER. The numbers in each figure correspond to each point in the graph shown in B. B, The ratio change in the tip region. After the addition of CPA, the ratio gradually decreased. After the addition of more CPA, the ratio decreased further.

