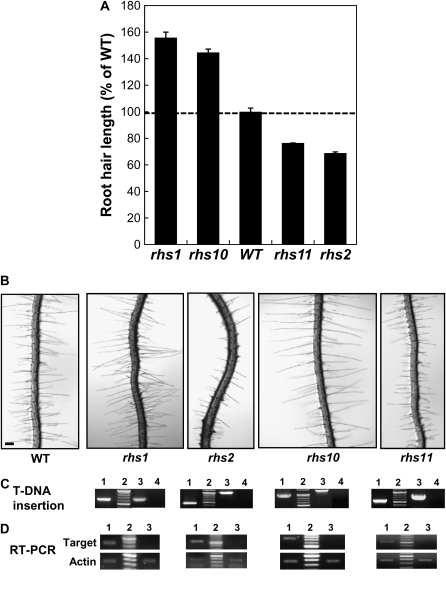
Figure 5.
Root hair phenotypes of the loss-of-function T-DNA insertion RHS mutants. A, Comparison of the root hair lengths of wild type (WT) and mutant plants. Mutant lines were SALK_027819 (rhs1; AT1G05990), SALK_126728 (rhs2; AT1G12950), SALK_075892 (rhs10; AT1G70460), and SALK_107520 (rhs11; AT2G45890). The bars show averages ± se of 650 (wild type), 290 (rhs1), 670 (rhs2), 1,666 (rhs10), and 3,840 (rhs11) root hairs. B, Root images of 3-d-old wild-type and mutant lines. Bar = 100 μm for all. C, PCR confirmation of T-DNA insertion in the target gene. Lane 1, PCR by LBb1 and gene-specific primers with mutant genomic DNA; lane 2, molecular size marker; lane 3, PCR by both gene-specific primers with wild-type genomic DNA; lane 4, PCR by both gene-specific primers with mutant genomic DNA. D, Confirmation of null mutations of the mutants by RT-PCR. Lane 1, RT-PCR by gene-specific primers with wild-type root RNA; lane 2, molecular size marker; lane 3, RT-PCR by gene-specific primers with mutant root RNA. Actin1 gene-specific primers were used for a loading control.

