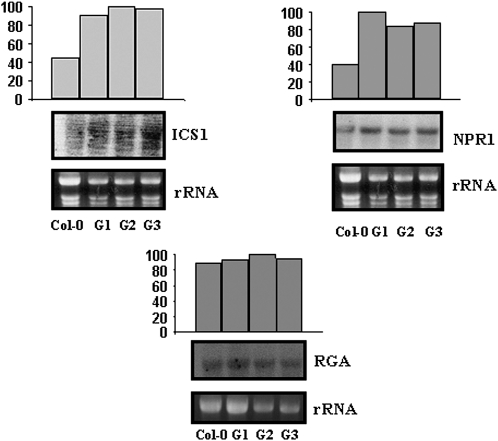
Figure 6.
Expression of the ics1, npr1, and RGA in FsGASA-overexpressing plants (G1–G3) compared to Col-0. mRNA levels of the indicated genes were determined by northern-blot analysis using total RNAs (10 μg/line) isolated from 7-d-old seedlings. Bottom: Ethidium bromide-stained gel showing rRNAs. Top section: Quantification of hybridization signals obtained by using a phosphoimage scanner. Data were normalized to the rRNA value. Blots were repeated twice and yielded similar results.

